
Every single choice we make online is documented somewhere in black or white, yes or no, one or zero. Millions of people, making millions of decisions creates an excess of data available for those looking to mine its insights.
These are “the numbers” that don’t lie, illuminating trends and supporting a wide range of claims and predictions. They present as patterns and correlations of interconnected information that work together to tell the story of what has happened and what could happen.
Unfortunately, the story the numbers tell frequently fails to give us the full picture. Even worse, data can be used to fabricate a range of stories. Did you know that the more cheese eaten each year, the more people will die by becoming tangled in their bedsheets? Don’t believe me? Here’s the data.
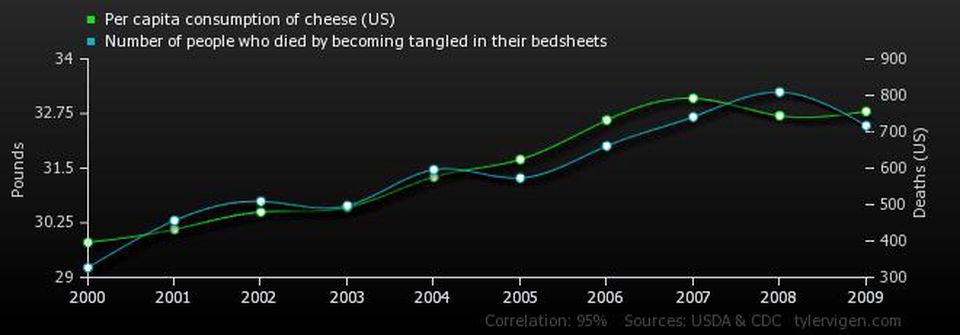
Because this example is so ridiculous, you probably know there isn’t a causational relationship between those variables. A correlation, yes - but because a change in one variable does not effect another, there's not much to imply from that data. In other words, death between the sheets isn’t caused by cheese consumption.
Unfortunately, when the variables seem believable, people are more likely to confuse coincidental correlation with causation. The two are sometimes difficult to separate. We can rarely prove causation with this kind of approach to data.
Identifying meaningful relationships between variables, especially regarding predictions about how these variables will change, is where we begin to find value from raw data.
For example, if we know that videos on social media drive more conversions than photos, we can predict that using more videos will lead to more conversions. This data, however, leaves something to be desired. We can predict what will happen, but not why it will happen.
Conversions could go up when we use videos because our animations are endearing, or because our vlogs create a more personal connection. We recognize trends but do not fully understand the problem. To fill this gap in our data, we must look to all sides of market research - recognizing that qualitative elements frequently underrated.
There are two major types of market research that use two different types of data. The first is what we’ve been most conditioned to know and trust:
Quantitative Data
This data is collected by measuring the quantity of something. It is often referred to as big data because it’s relatively easy to collect and record massive amounts. The data allow us to set goals and determine whether we’ve achieved them. They let us see the routines people follow, and how they’ve changed over time. They’re our history ledgers, and our mathematical predictors, but they only tell us what, not why.
Big data fails when the system is not already optimized. Unless you already have the perfect product, distribution, marketing, etc., big data is unable to give you the best solution. It can be bad for out of the box thinking, because it only draws on insights that have already been developed.
Quantitative research is limited by the gaps in big data. Quantitative data without qualitative data is like a person who has no skeleton. If there is no frame, or context, the data won’t mean anything. It is an essential tool, but it is not made to stand alone.
Qualitative Data
Qualitative data is all the information that hasn’t been condensed to a number or preset option. This data can be used for "outside the box" thinking, and is one of the key differentiators of a growth studio approach. While quantitative data is usually measured by numbers alone, qualitative is recorded in sentences.
Instead of measuring how consumers behave, this research can get to the core of why they think or behave the way they do. To illustrate the usefulness of this data, let me recount a story told by Harvard Business School professor, Clayton Christensen:
McDonald’s is an extremely sophisticated marketing company because of their size, reach, and budget. Every McDonald’s across the world is constantly collecting big data on customer behavior.
They decided they wanted to use this data to innovate in their milkshake line. They created a consumer persona based on the data and invited similar customers to answer questions about how to improve their experience.
They each made suggestions about the makeup of the milkshake, but the data showed that no combination of flavors could make a difference. Instead of asking how they like their milkshakes they started asking why they like their milkshakes.
The data showed most shake customers came in the morning, so they went to the nearest restaurant and asked local customers why they bought milkshakes at 6:30am.
This lead them to the discovery that people didn’t care about taste but viscosity. The thick shake and small straw made it perfect for morning commuters. They wanted something that would both fill them up, and occupy their mind during a boring drive.
Asking why allowed them to uncover what job the customer was trying to do. They had the data all along but didn’t understand the context until talking to customers. Like a structure without bones, data without insight is deadweight.
When you understand the patterns in what people do, you can tailor your business to meet them where they stand. After all, if you want to reach new customers, it’s a good idea to start by looking in the places you expect them to be. This is like fishing with a rod. You can predict where the fish might be, so you cast in their direction and wait for a bite.
On the other hand, when you understand why they act, you can fish with a net; This means hauling in new customers that were previously lost to nonconsumption. You can produce strategic insights to not only see where they are, but where they’re going. This will usually help a company, or fisherman, grow into a category leader.
Qualitative Research
Qualitative research comes in a few different styles. Here’s a short run through of how and when to use them:
- Personal Interview - The personal interview is the ideal option for measuring specific reactions, and sharing a lot of stimuli. This will allow the researcher to pay close attention to detail, and is usually more effective for sensitive questions. While an individual may lie in group settings or written exams, some are more comfortable having a private conversation.
- Focus Group - This method consists of about 6-10 people and a moderator discussing 1-2 key topics over a couple of hours. Fortunately, these don’t have to follow the bland stereotype, and can produce unique insights. For a little extra fun, have your focus group compete in team activities. These activities might include mock selling to another team, or creating alternative products.
- Ethnographic Study - This study focuses on how individuals behave in their natural environment. When researchers meet people at their school, work, or home environments, they can learn new things about their problems and the solutions they seek.
In the end, Qualitative data is used in the art of storytelling. You have to pick out the details that matter, and use the context of a participant to decipher their behavior. It’s time consuming, and sometimes expensive, but the insights drawn from these methods can be priceless.
You must constantly be asking about the story behind the numbers, not just the numbers themselves.
Full Circle
There’s actually nothing wrong with big data, it’s just user error. While these metrics can be helpful, they don’t replace the storytelling capabilities of qualitative data and they shouldn't have to. The two should always go together. Use discrepancies in big data to reveal where your story is missing some lines, just like the McDonald’s shake experiment.
Support your qualitative insights with real numbers, and solidify the full story behind your customer experience.
P.S. The Gartner Hype Cycle, a yearly report on new technologies and their adaptation, removed big data as a stand alone technology in 2015. This is because the data has become part of so many trends and technologies, that it can no longer be considered its own category. This goes to show that data is better used in tandem with other information, not as the answer to every question.